Sydney Currier

Sydney holds a BAS and MSc from the University of Windsor. Currently, she is happily merging her love of art and science as a member of the Canadian Science Publishing marketing team.

Visualizing science with in vivo live imaging

July 21, 2021 | 4 minute read

Q&A with Aaron Scott

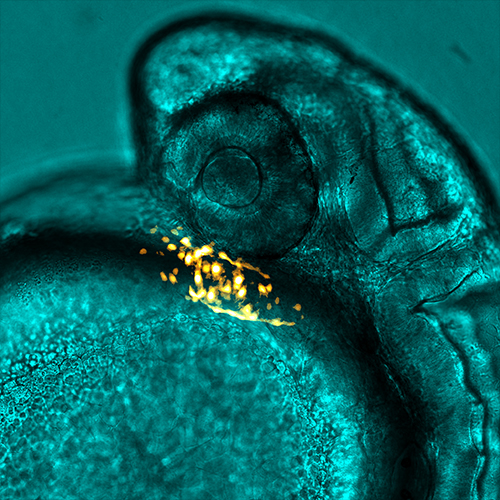
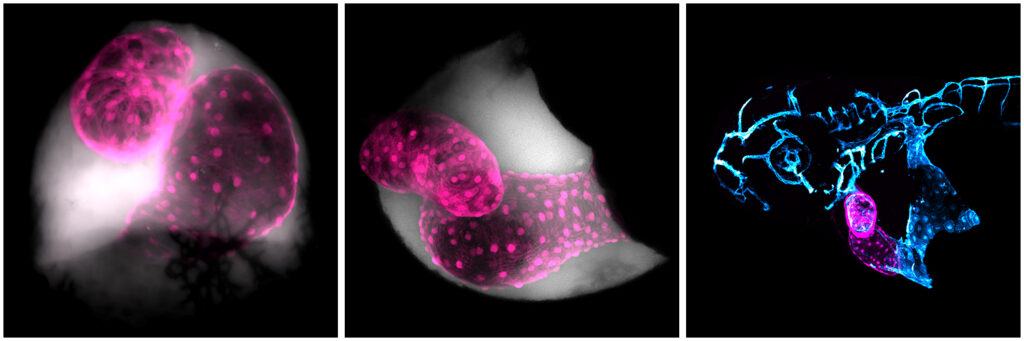
Picture this: fluorescent green cells dancing inside a fluorescent red pulsing shape, the heart of a zebrafish. It looks an awful lot like a baby alien. And it’s all happening beneath a microscope lens. Peering into this world, you suddenly and simultaneously feel so big and so small in comparison.

This is an everyday experience for Aaron Scott, although you’ll see the magic isn’t lost on him. As an in vivo cell biologist at the University of Bristol he uses microscopy to visualize nano-sized extracellular vesicles in zebrafish to understand their connection to cardiovascular disease.

Aaron will be judging the From the Lab category for the 2021 Visualizing Science Contest.


What drew you to cell biology?

I took a rather winding path: starting with pure biology, quickly moving to zoology, a small stint with environmental biology and finally landing on in vivo cell biology. I’ve always loved animals, but to my disbelief zoology as an undergraduate left me rather uninspired. I then took a sidestep into environmental biology and after joining an awesome lab at the interface between ecotoxicology and cell biology, I started working with transgenic zebrafish and fell in love with cell biology. The first time I looked down a microscope and to see a fluorescent heart beating, I was hooked! So, the short answer is, transgenic zebrafish and microscopes—6 years later and I am just as fascinated by this part of my job.

Every time you look down the microscope, you’re guaranteed to see something new and exciting—I particularly love the novelty of looking at transgenic lines I’ve never used before. There’s just so much power in the light microscopes we use and when you’ve got fluorescently labelled cells going about their business inside a living organism that is transparent, there’s a whole world to explore, a world I’d never dreamt was even accessible when I started my journey into science.

What is the biggest challenge you face with visualizing nanoscale particles and how do you navigate this challenge?

Visualising what we thought to be extracellular vesicles in vivo was quite straightforward, the two big challenges are their tiny size and how rapidly they travel through the peripheral circulation, for example. Most extracellular vesicles are smaller in diameter than the wavelengths of light, which means they cannot be resolved—but if the fluorescent label is sufficiently bright, then they can be detected and tracked. So first, we need microscopes equipped to image quickly—as an example we image in peripheral circulation at around 50 frames per second. The difficulty is with the combination, the reality of microscopy/imaging is that if you want high spatial resolution, then it will take more time to gather the data and so decrease the temporal resolution. However, the light sheet microscope performs optimally in this regard and has helped to meet this challenge.

The biggest challenge has been verifying what the labelled particles we see in vivo actually are, and specifically validating our zebrafish model for visualising endogenous extracellular vesicles in vivo. Many challenges arise when trying to extract extracellular vesicles from whole tissue, but a full characterisation based on size, density, and protein content is unfortunately not possible in vivo.

What do you think is the most important thing a researcher should consider when using microscope photography for science communication?

Routine fluorescent light-based microscopy only really provides us with inaccurate numbers; a number is generated based on the brightness of the object being detected and this number is spatially resolved when assigned to a single pixel of the outputted image, where it is usually represented on a linear scale of grey values, ‘0’ being white and ‘255’ being black in an 8-bit image, for example. As scientists using microscopy, we are well accustomed to image manipulation and analysis tools to help us gather as much information and value from that data as possible.

Whilst we have fairly clear rules in how we can and cannot manipulate images for scientific publication, these rules obviously do not apply in the same way to the intersection between science and art. When dealing with science communication, we likely wish to inspire and inform. Our images can be enhanced, cropped and edited to better convey our message. But I think it’s still important that we’re upfront and transparent about what the viewer is seeing, there is already too much confusion, frustration and mistrust when it comes to scientific public engagement and we definitely don’t want to add to this.

The Visualizing Science Contest celebrates research moments, created and captured in visual forms.

Header and in-text images:  Courtesy of Aaron Scott

Disclaimer: The views and opinions expressed in this blog post are those of the interviewee and do not necessarily reflect the official policy or position of Canadian Science Publishing.

Updated August 18, 2021

Sydney Currier

Sydney holds a BAS and MSc from the University of Windsor. Currently, she is happily merging her love of art and science as a member of the Canadian Science Publishing marketing team.