Q&A with Veronica Coppolaro
From collecting data on sea ice to photographing polar bears, we’re going above and below Arctic waters with Veronica Coppolaro.
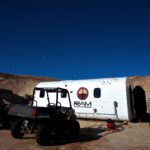
 A PhD student at the University of Manitoba and Fisheries and Oceans Canada, Veronica uses passive acoustic monitoring of Arctic marine mammals to determine the implications of a changing Arctic on their populations and habitat use.
Veronica’s image “Inverted bathymetry for sea ice thickness measurements” was the 2020 Visualizing Science Contest winner for the From the Machine category.
What is the biggest challenge you face with photographing animals in the Arctic and what advice would you share to navigate this challenge?
A common issue when photographing wildlife is, of course, finding your subject and taking a picture which is representative of the situation and the animal behavior at that time. In the Arctic, achieving this is even more challenging due to the extreme weather conditions, especially in the winter. Moreover, many Arctic species are classified as endangered and special concern, so we should be even more careful when approaching them as our proximity might have negative influences on these animals, both in the short and long term.
My two pieces of advice are 1: Before going out for a photo shooting session in the Arctic, always bring your rain gear and warm clothes, even if it is sunny outside; the weather is unpredictable, and you might regret having to go back inside and miss a great shot because you are cold. And 2: Even though it is tempting sometimes to get closer to animals to observe them and take a good picture, it is important to keep our distances from wildlife. Avoid provoking a polar bear or disturbing a nursing seal pup. Conservation should have priority over a good picture.
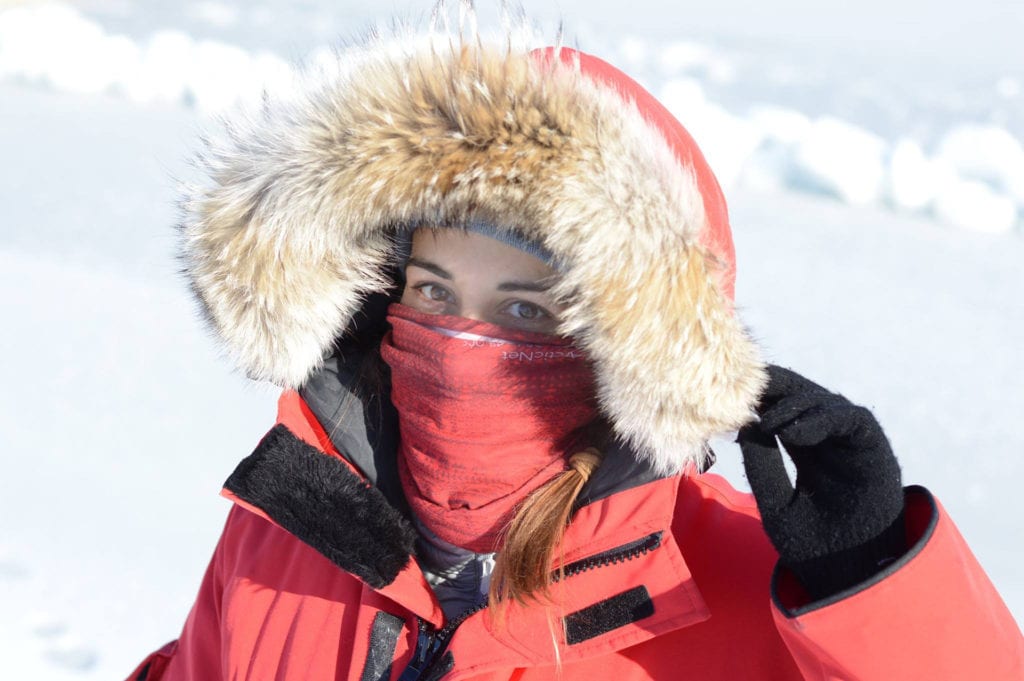
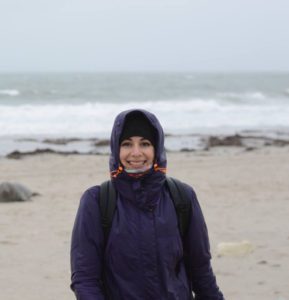
Veronica dressed for the elements in the field | Veronica Coppolaro
How do you transform sonar data into a map?
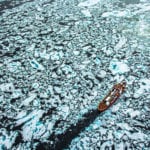
Sonars have been used for decades to produce maps, such as bathymetric charts. They work by sending out an acoustic signal and collecting its echo after it has been reflected by a target, in this case, the ocean floor. However, more recently this methodology has been successfully used to measure sea ice thickness and produce 3D maps of the sea ice cover. You can imagine this as a sort of “upside-down bathymetric map” of the underside of the sea ice. This is possible when a sonar is mounted on an underwater vehicle which cruises under the sea ice with the instrumentation looking upwards. A pressure sensor (PS) and a multibeam sonar (MBS) work together to collect data at each position of the vehicle: the distance from the vehicle to the sea level and to the sea ice. When these two measurements are subtracted, the thickness of the submerged part of the ice is found; the total sea ice thickness is then calculated using a model. It is quite a convoluted process, but the resulting maps of sea ice thickness can help our understanding of sea ice dynamics and improve current climate models. And, besides, these maps are also visually captivating.
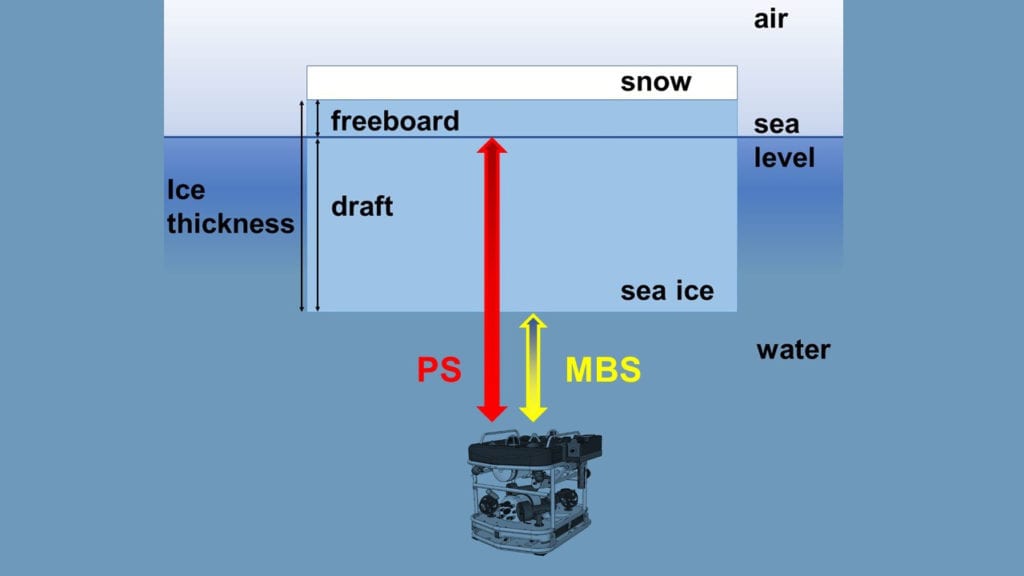
Figure showing how sonar collects sea ice data | Image copyright: Veronica Coppolaro
Tell us about a time when taking a photo in the Arctic didn’t go as planned
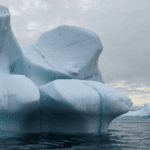
The first time I saw a polar bear in the wild I was on an icebreaker in the European Arctic, north of Svalbard. Since I was told I would join the expedition, I had been dreaming of seeing polar bears and taking pictures like those amazing shots that appear in wildlife magazines, with polar bears reflected in melt ponds. When my moment finally arrived, I was just so amazed that I spent half of the time staring at the bear with my mouth open, and the other half trying to take a good photo. Later that day, when I checked my pictures, I sadly found out that they were all blurred; I was so excited that I forgot to adjust the focus properly.