Open data—data available for anyone to access, use, and share—are playing a crucial role in our response to the COVID-19 pandemic. In Canada, open government data ensure real-time tracking of COVID-19 cases and vaccination. These data also support transparent reporting of the economic and social impacts of COVID-19.
Open data are “a powerful tool that can spur innovation, inform decision-making, and ultimately save lives,” says Wilfreda Edward-Dolcy, open data specialist with Canada’s federal-level Open Government Team.
While support for open data is surging amidst the COVID-19 pandemic, countries and governments worldwide have long recognized the value of open data for responding to global challenges.
With increasing volumes of data freely available, the following advice is worth considering the next time you consider using open data.
1. Ask the right questions of the data to get the best answer
The open data movement is constantly evolving. Those involved embrace it. For Canada, initially, the focus of its open data policy was to release or “publish” as much data as possible.
“As we mature in our open data journey… we’ve shifted gears towards working to ‘publish with a purpose’,” says Edward-Dolcy, who also serves as Canada’s Government Co-Chair to the Open Data Charter Implementation Working Group. That is, releasing data guided by the needs and priorities of the public.
Publishing with a purpose doesn’t mean the data released have one specific use or analysis in mind. “I think the most important consideration is the flexibility of open data,” says Edward-Dolcy.
For users of open data “[t]o begin to capitalize on that flexibility, it’s important to ask the right questions of the data to glean the right solutions. What problem are you trying to solve, and how does open data support those efforts?” she adds.
Being open to “unconventional pairings [of data],” Edward-Dolcy says, can help reveal hidden problems or find novel solutions. For example, combining gender disparity data with climate data can improve our understanding of “the disproportionate impact of climate change on women versus men.”
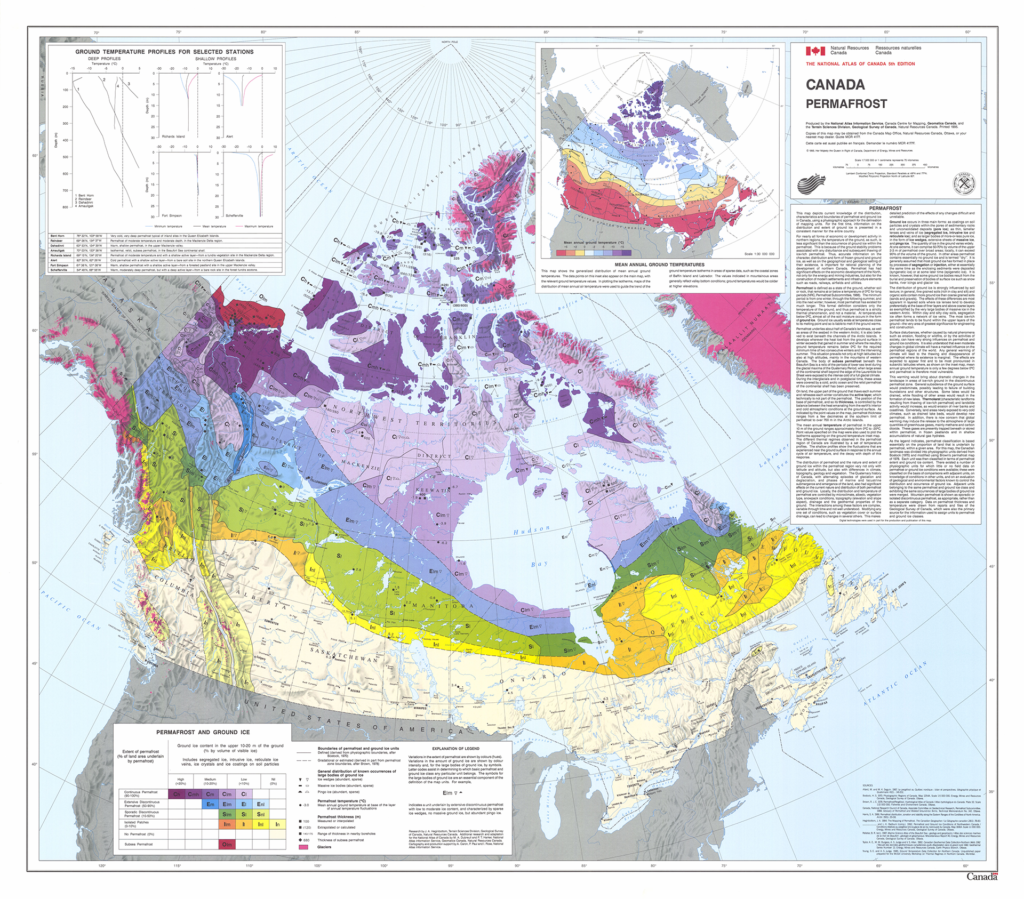
 The Government of Canada’s Open Government Portal contains a multitude of data types covering a host of subjects. This Permafrost map, which originates from the Atlas of Canada, 5th Edition (1978-1995), is available as a static image and in various formats for use in geospatial software in French and English. Credit: Natural Resources Canada (Open Government Licence – Canada)
2. Expect volume, consider provenance
The open data revolution is a relatively new event, largely made possible by technological advancements such as internet connectivity and cloud storage.
“I remember when I first started in environmental remote sensing, data wasn’t free,“ recalls Jason Schatz, Chief Technology Officer at the non-profit environmental watchdog, SkyTruth. “[F]or a class, my professor bought a bunch of Landsat data from the NASA program, and it was expensive. Now, with the amount and accessibility of data out there, you can really change things.”
SkyTruth harnesses a range of open geospatial data to identify and monitor environmental threats and draw attention to unsustainable or harmful practices.
Those data include raw data (e.g., satellite imagery) and derived data, which are created from one or more existing data sources (e.g., types of land cover).
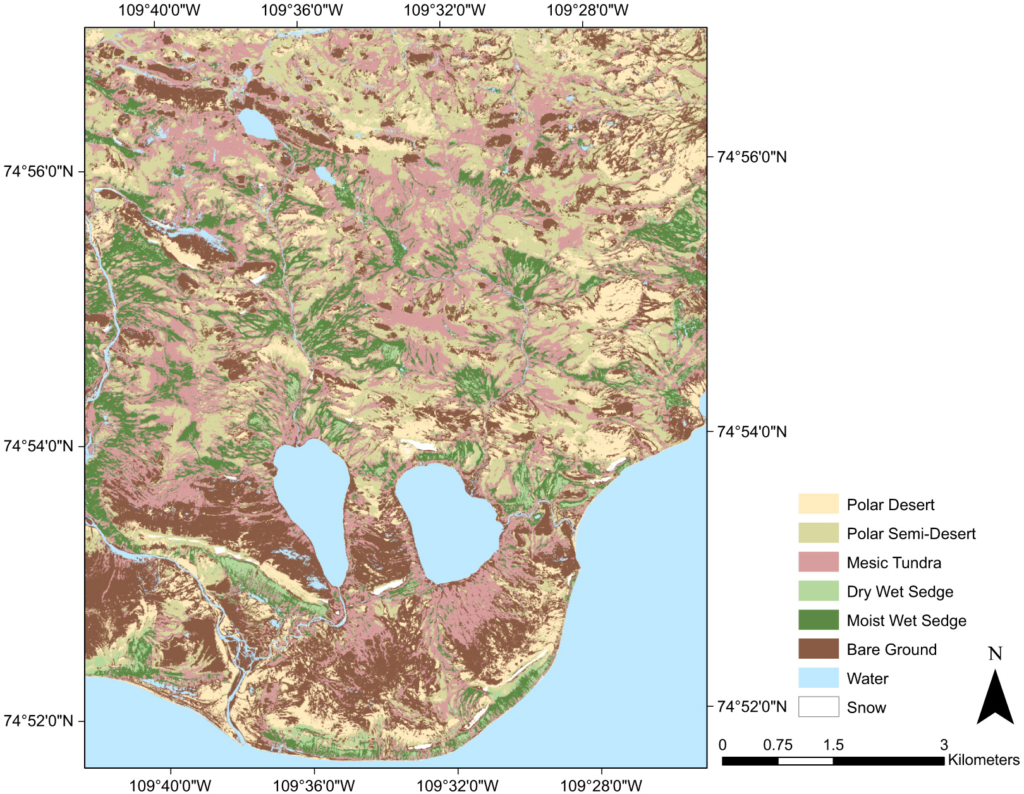
Land-cover classifications, like this map of the Cape Bounty Arctic Watershed Observatory, are examples of derived data. | https://doi.org/10.1139/as-2019-0029
When it comes to raw data, “many open datasets are massive, or obscure, or come in cryptic formats,” says Schatz. Users may find themselves sifting through vast amounts of information to get the specific data they need. “Knowing where to look is half the battle. Pulling useful insights from sometimes huge datasets is the other half,” he says.
Derived data products combine and process raw data, often from different sources. For this type of data, Schatz recommends users carefully think about the product’s origins. “For what purpose was a given dataset made, how much uncertainty is associated with it, how was that uncertainty evaluated, is it updated, and are you using it appropriately, given that provenance,” Schatz explains. “It’s important to have confidence in your sources and confidence that you’re interpreting the information correctly.”
Open data also helps build confidence in the products or analyses created with it. “When the data is free and open for everyone, people can check our work and pull down the exact same data we do and do some extra verifications if they want,” says Schatz.
3. Do your own quality control checks
A well-known derived data product is the Global Biodiversity Information Facility (GBIF), which provides “anyone, anywhere, open access to data about all types of life on Earth.” These data come from “around 1,800 different institutions around the world, ranging from natural history museums with vast collections of specimens that are digitized … to citizen science projects,” explains Daniel Noesgaard, Science Communications Coordinator at GBIF.
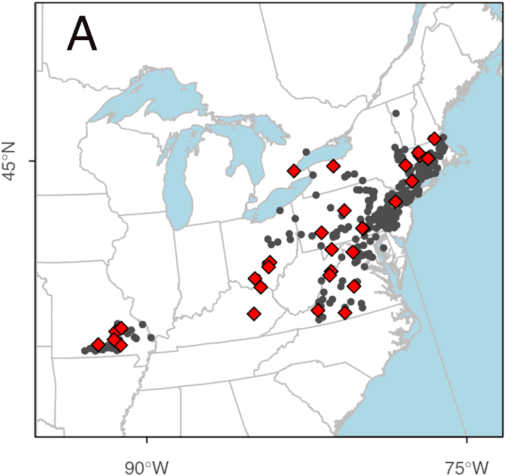
Populations of Few-flowered Club-rush used to study genetic diversity. Grey points are Global Biodiversity Information Facility (GBIF) records. | https://doi.org/10.1139/cjb-2021-0195
Although GBIF makes the raw data provided by the data supplier available, they also offer an “interpreted” version, which includes some information added by GBIF that was missing from the raw data (e.g., providing the name of the country when only coordinates are provided).
“We [also] flag any issues that we believe might be of use to the data publishers and also anyone looking to use the data,” says Noesgaard. “Examples of that could be a record in country A but with coordinates belonging to country B. Or a record of an insect species claiming to be a bird,” he explains.
Just as peer reviewers of data papers complete checks of the focal dataset, users of open data should perform quality control checks, too. “Quality control will depend on the type of analysis that you want to perform on the data,” says Noesgaard.
For biodiversity observation data, one of the controls is to make sure the locations that species are being reported as occurring makes sense. For example, a marine fish observation located in the middle of Canada is unlikely to be accurate. “By [visualizing] occurrence records on a map, you will be able to easily identify outliers…[and determine] whether the occurrence point is found in the species native range or not,” offers Noesgaard.
4. Always recognize the source of the data
Even with guidelines, authorship can be difficult to navigate. Data are an integral part of any study; in some cases, studies couldn’t be done without access to data collected by others. So, should these data creators be invited as authors?
Dr. Sam Bashevkin, a Senior Environmental Scientist at the Delta Stewardship Council, says the answer is, in most cases, no.
“It’s no different from references cited within the paper that were necessary to develop the hypotheses being tested,” he says. “Should the authors of those prior papers be included as authors of papers building on their work? I don’t think anyone would say ‘yes’ to that question.”


